


 8 / 44

TOURISM
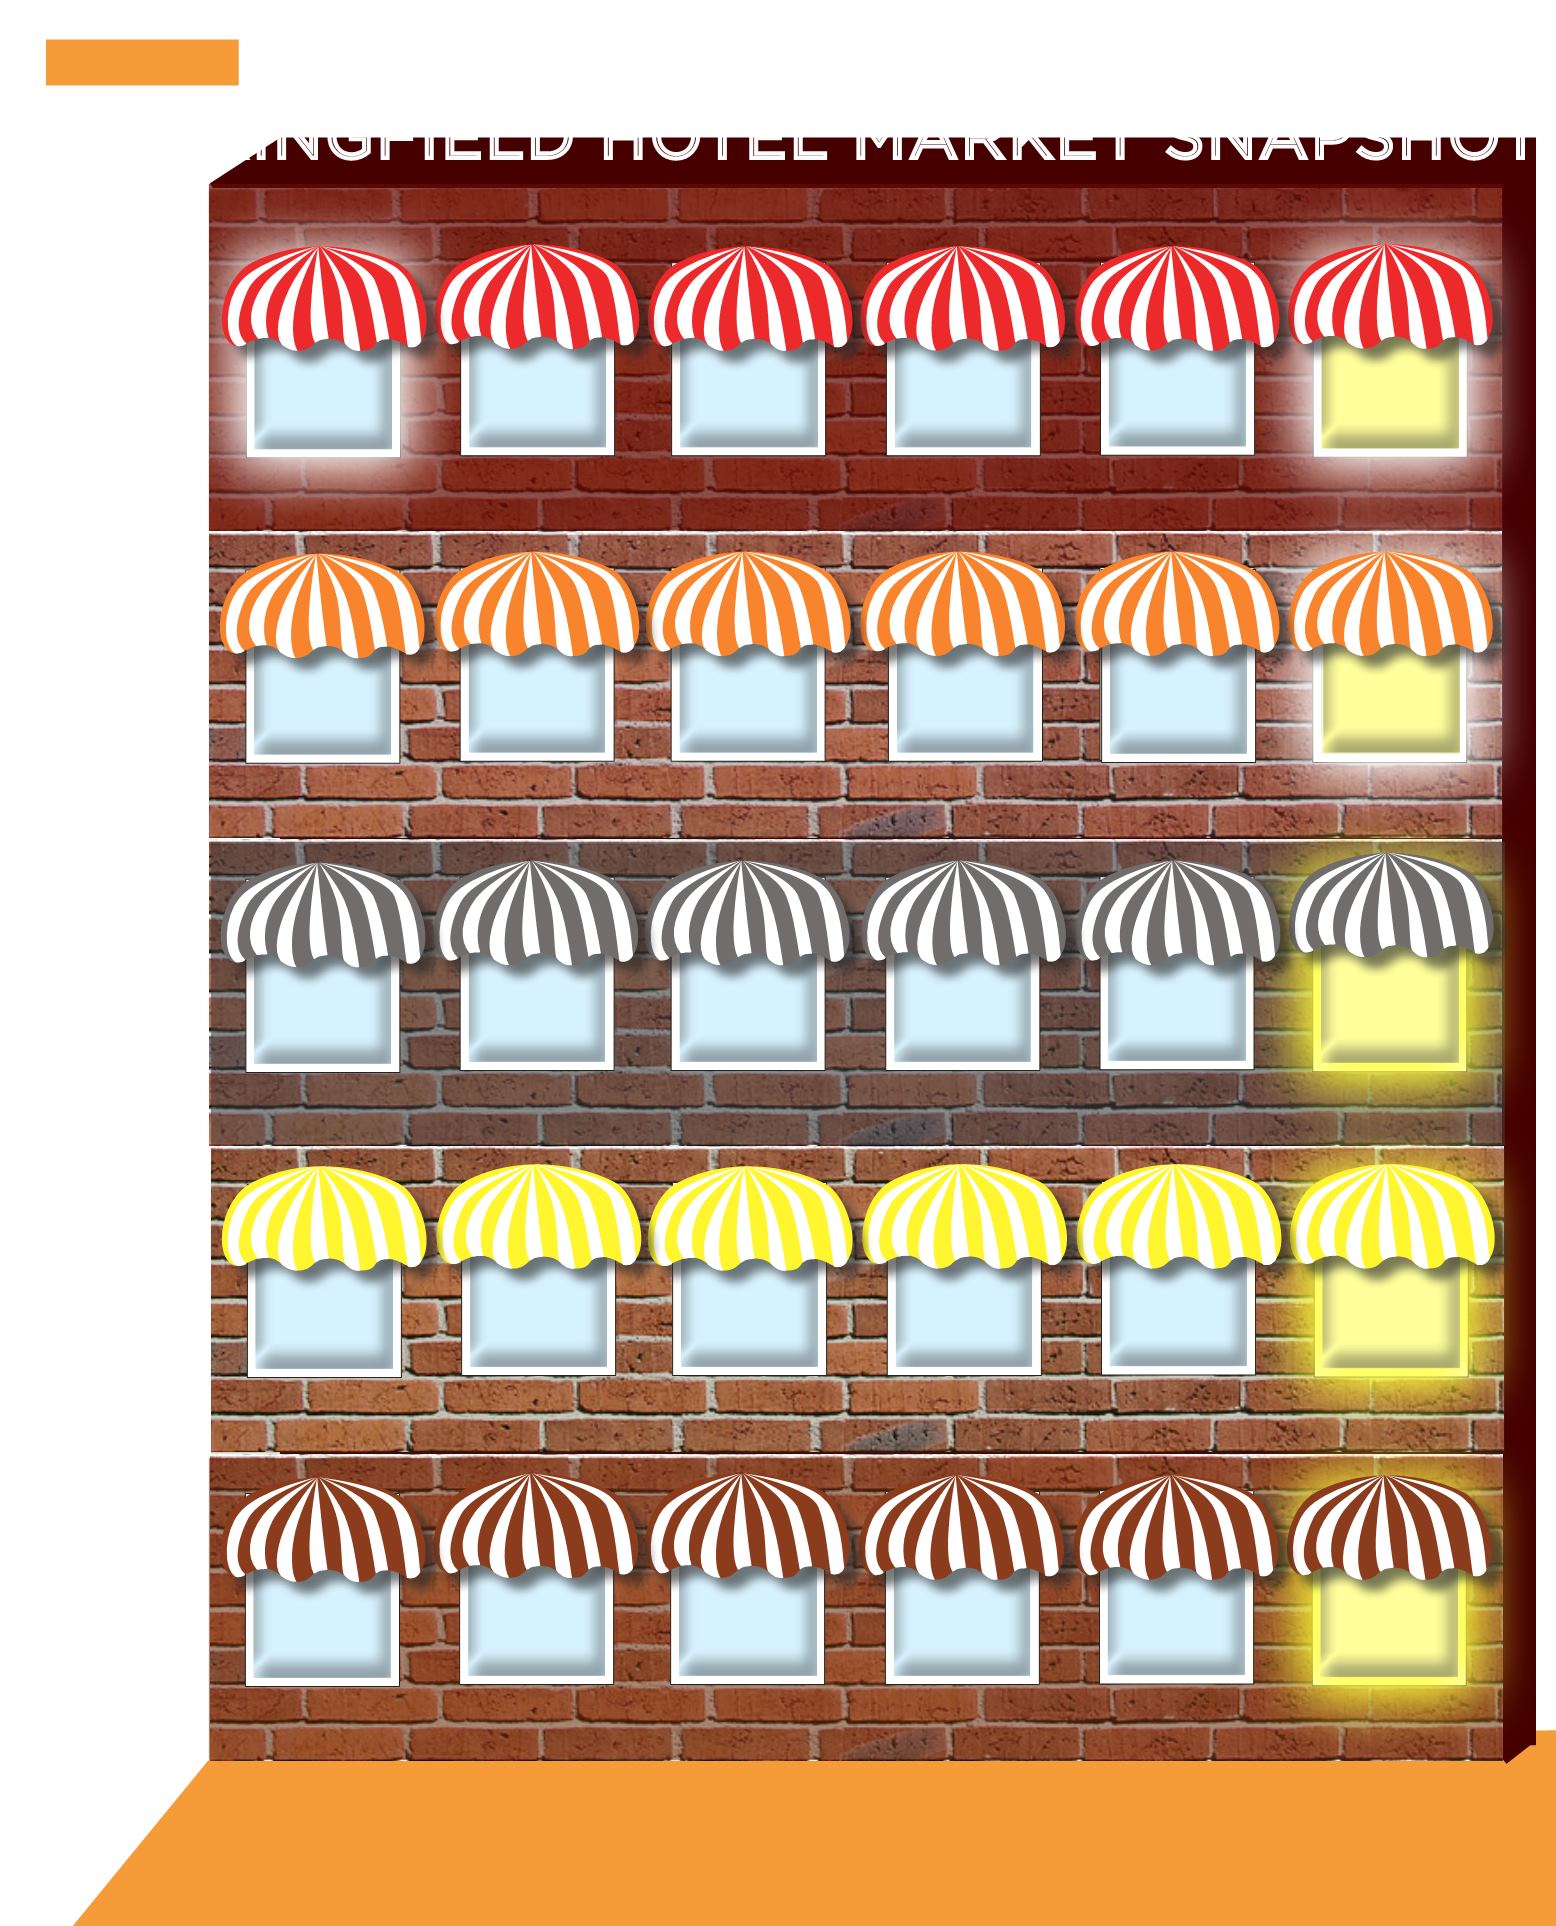
SPRINGFIELD HOTEL MARKET SNAPSHOT
$39.19 $44.28 $47.55 $50.60 $53.53 $56.50
$3.9M $4.23M $4.6M $5M $5.3M $5.9M
2013
2014
2015
2016
2017
2018*
5,825
5,661
5,645
5,816
5,765 5,959**
Total
available
rooms
per day
Annual
occupancy
rate
Revenue
per
available
room
Annual
room tax
collections
(total)
Average
daily rate
$70.99 $75.15 $79.47 $81.09 $83.41
$86.50
55.2%
59.9% 62.4% 64.2% 65.5%
59.9%
Source: Springfield Convention and Visitors Bureau
*estimate
**356 additional rooms are under construction
BOOK OF FACTS-8
·
SBJ.NETFALL 2018